
Data Analysis, Data Mining, Machine Learning and Artificial Intelligence. These are the words you might have heard quite frequently these days. Spared a thought to think of those? What is all this buzz about? To give you a fair idea and to get you excited about this field, here is a small video explaining the potential of machine learning and artificial intelligence.
This is the video of an autonomous car “ALVINN” which uses a Supervised Learning paradigm(Dont worry everything explained below) to drive a car on its own. If that is not interesting then what is?
Now you might get the following question.What is machine learning and how is it related to artificial intelligence? All this will become clear as you dwell deep into this field. Many of you might have made efforts to understand and work in this field but may have faced lot of difficulties in the process, most of which are due to difference in background and the lack of resources. MachineLearningSchool is an effort from our side to present the complex topics of Machine Learning in a crisp and intuitive way so that people from various backgrounds can easily understand and apply them.
So what is machine learning (also referred as ML) really about? What do you need to know to read books or research papers in this field? Today’s topic is just an introduction, to help you get acquainted with the “lingo” of machine learning. Let’s say you have a problem and want to rectify it with the help of a machine (you know we humans are lazy). So the first thing you have to do is to teach the machine how to solve the problem. In layman terms, this is machine learning. Any problem you want to solve in ML boils down to one of the two sub problems (might be a mix at times) which are Classification or Regression. Let’s try to understand them better.
Classification
According to Wikipedia “In machine learning and statistics, classification is the problem of blah blah blah blah blah blah” (A definition we have to know, but not the one we need right now *the dark knight feel*).
Let’s understand what classification is with the help of a small exercise. How do you or I recognize a particular fruit, for example say, an orange or an apple? For this experiment, assume that you are blindfolded and allowed to touch the fruit.
 What is the first thing you would do? Hold the fruit and try to figure out the shape of it. If it isn’t conical or has a roughly spherical or oval shape, you can cut down on a lot of options like the banana or the pineapple. The next best thing you can do is, to compare the size of the fruit with the size of your palm. If the fruit fits your palm exactly, you can drop the options of it being a cherry or a grape. What would you do next? Can you get some information using the texture of the surface of the fruit? If the surface is relatively smooth, it can be an apple or a guava. If it’s rough, it can be an orange or an avocado. Is this information sufficient to tell if the fruit is an apple or an orange? No, we would obviously need some more information. Let’s say that you are allowed to taste a small piece of the fruit. If it tastes sweet, there is a chance the fruit is an apple and if it’s sour, it might be an orange. Even this information along with the past knowledge of the shape and texture might not be sufficient sometimes to differentiate between them. Now if the color of the fruit is revealed, you can confirm the fruit with some confidence but then again, there are apples which are green. Finally when you see the fruit, you can safely say if it’s an apple or an orange or neither. One might ask, why were you asked to think about this experiment in the first place? Would you be able to guess the fruit without all the information you gathered using touch and taste? Each experience gave you some additional information about the nature of the fruit. This is how we as humans perceive objects around us. We try to compare the new information obtained now, to our past experiences and if there is match, we try to group them together. If there is no match found, we add it as a new set of information for future comparisons. To keep it simple, this is how an apple/orange is understood by our brain. These small sets of so called experiences are called “features” in machine learning language. These features help us understand the nature of the fruit (can be extended to other objects too) under observation. The types of fruits i.e., oranges and apples here, are referred to as classes (2 in this case but can be more than that).
This (apple vs orange) is a simple example of a binary classification problem i.e. given a set of “features” classify the fruit into one of the two classes. The next question to ask is, can you do this entire experiment without having a previous experience of touching or tasting an orange or apple (or both)? Not quite possible right? If you didn’t see or touch an apple (or orange) previously in your life, it is not possible to classify the fruit as an apple (or an orange). So the previous experiences with the fruits you have, becomes very important before thinking about classification.
The branch of machine learning is entirely based on this premise. Let us break down the term machine learning. You are helping the machine learn something, just like you teach a kid. How is it possible? The simplest way is to give the machine enough examples (in this case, experiences with apples and oranges) so that when it encounters a new fruit it tries to use its previous experience to understand if the fruit is apple/orange. In a way you are telling the machine that, if the fruit is red/green and tastes sweet it might be an apple and if it’s sour and orange in color, it is an orange. So you have played the role of a “teacher” or a “supervisor” by telling the machine each time that the particular experience is caused by an apple or an orange. Since there is a supervisor who tells the machine that the experience corresponds to one of the classes (orange or apple), this is called Supervised Learning. It might sometimes happen that you share your experiences (smooth, tastes sweet, red in color etc.) with the machine but don’t provide any information about the class (orange/apple) of the fruit and expect the machine to learn on its own. This kind of technique is called Unsupervised Learning. Unsupervised because you are not really telling the machine which fruit it is, but just providing it with some experiences (features).The video you saw in the beginning of the post uses Supervised learning to train the car to drive on its own(You might have heard the speaker say, the driver drives the car first for a few seconds and ALVINN observes what the driver is doing). It is like your father teaching you how to ride a cycle or a bike. You first observe what he is doing and then try to do the same. Simple isn’t it?
There are other types of learning paradigms other than supervised and unsupervised learning, which we would deal in future articles.
The experiences you had with these fruits, which you shared with the machine, is usually called training data. Using the training data, the machine develops rules to classify a new experience to one of the classes (apple or orange). But will the machine be able to differentiate between apple and oranges if the training data given to it only has experiences with apple (or oranges but not both). No, it should also see or feel how an orange looks and tastes like to differentiate it from an apple. So a valid training dataset would have experiences of both apples and oranges. The new experiences on which the machine is evaluated is called the testing data. So the testing dataset would only have the features of the fruits but not the labels. All this said, classification can shortly be described as, given valid training data, classify a testing sample to one of the available classes.
Wouldn’t it be nice if everything is so ideal and as simple as explained above? The world is a cruel place and no problem you encounter in real life is as easy as explained above. We would explain how the training data affects the learning and how the classification rules are automatically generated from the training data in future articles. Now let’s move onto the next section of the article where the other kind of machine learning technique i.e. regression is discussed.
Regression
Now that you have a fair understanding of what classification is, let us explore the other kind of problems where machine learning can be applied. Given that the chilly winter season has now set in, let’s start by taking an example of a hot chocolate serving outlet my friend has opened recently. As you might have guessed, his sales would increase if the air temperature falls down since people would yearn for a hot drink in the freezing conditions. But as every other person who is new to business, he made a rookie mistake. He overestimated the demand initially and since the stuff that goes into making the different beverages are perishable, he suffered from losses. So, he started looking for ways to forecast the demand approximately to avoid the losses. He started by collecting the data of the sales of different items on the menu and the temperature of that day.
Now that he has the relevant data, his next step would be to forecast the sales, for say tomorrow, given the temperature estimates from the weather channel. This kind of problem falls under the second category of machine learning called “Regression”. So basically, regression is the estimation of a continuous output variable from a series of other changing (mostly independent) variables. As you can tell, it’s quite different from classification in terms of the nature of the dependent variable. In a classification problem, like the one discussed earlier, the number of classes were limited (ex: orange, apple, banana etc.). In case of regression, the dependent variable (output variable), to be predicted, is generally continuous in nature (ex: the sales for the next day which can have a broad range from 0 to say 10,000).
Now that you have an idea of what regression is, the easiest and most intuitive way to approach this problem is by plotting the data points and examining the relationship between the dependent and the independent variables. For this example, we get the below scatter plot by using the historical sales data.
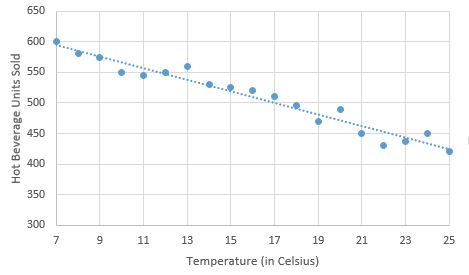
From the plot, it can be seen that the sales exhibit a linear relationship with the temperature. So we can use a straight line equation, given below, to model the relationship between the sales and the temperature.
y = a*x + c
Substituting the respective terms, we have:
Sales = a * Temperature + c
The above formulation is termed as Simple Linear Regression and by intuition, it represents the straight line which best fits the historical data points. ‘Simple’ because there is only one independent variable (temperature in this case) used to estimate the dependent variable and ‘linear’ because we assume a linear relationship between sales and temperature.
Let us take a closer look at the above equation. ‘a’ is called the regression coefficient for the temperature variable and is the amount by which the sales will change for a unit increase in temperature. By intuition, ‘a’ should be negative since sales increase if the temperature falls. ‘c’ is called the intercept (like in a straight line equation) and can be interpreted as the sales that would take place when the temperature is zero. The intercept can also be interpreted as the constant part of the sales which cannot be explained by the variance in temperature.
As you would have probably guessed, the sales on a particular day would not only depend on the temperature but also on various other factors such as discounts offered, whether it is a holiday, availability of special items etc. These factors can be easily incorporated into the model as shown below.
Sales = a1 * Temperature+a2 * Discount+a3 * isHoliday+a4 * SpcItemsPresent+ c
The above formulation is termed as multiple linear regression and by intuition, it represents the plane which best fits the historical data points. ‘Multiple’ because there are now more than one independent variable used to estimate the dependent variable and ‘linear’ because the relationship between the dependent and each of the independent variable is still assumed to be linear.
Here, the terms ‘a1’, ‘a2’, ‘a3’ and ‘a4’ are the regression coefficients of the respective independent variables and c is the intercept. The variable “isHoliday” and “SpclItemsPresent” are indicator variables i.e. they take only two values, 0 or 1. So if it’s a holiday, the “Holiday” variable becomes 1 and contributes to the sales by an amount “a2”. “SpclItemsPresent” also behaves similarly as the “isHoliday” variable
Now that the formulations have been done, the next step involves the estimation of the unknown terms, ‘a1’,’a2’,’a3’,’a4’ and ‘c’, in the above equation. This is where the machine learning would come into picture. But before we get into the estimation part, let us look at the purpose of this estimation process again. We want a system which gives a reliable forecast of the sales given the set of observable independent variable. So the ideal values of unknown terms in the above equation would be those which would give the most accurate forecasts. To put it in another way, we would like to choose those values for the unknown terms which would reduce the average forecast error. Now you would have understood why I wanted to re-iterate over the objective. In the next article, we shall discuss about how the coefficients can be chosen to minimize this forecast error.
Interestingly, a regression problem can be converted into a classification problem, if the dependent variable can be segmented into bins. Let me break that up for you. Let us assume that our friend is only interested in finding if the sales are below 1000, between 1000-10000 or above 10000. Now, we can impose these conditions on our sales data and create a new variable which takes the value of 1, 2 and 3 respectively if the respective conditions are satisfied. Now that we have a reduced number of classes, we can treat this as a classification problem. But there is a downfall to it. As you might have noticed, when we are binning the sales variable to create a categorical variable, we lost granular information about the sales. We can now just know when the sales are below 1000, between 1000-10000 or above 10000 but can’t get the exact volume of the sales.
So to summarize, classification is the task of assigning an object to one of the classes based upon it’s features and regression is the problem of finding a line/plane which best fits the given data points. We shall further explore the intricate details of each of these topics in the upcoming posts. We will adhere to our promise of keeping the content simple and easily understandable while delivering the beautiful mathematical concepts in the machine learning field.
Now that you are excited about machine learning( fingers crossed 😛 ), here is another wonder it can do. Watch Google DeepMind’s alpha go defeat a human in Go.
Please provide us your feedback about the post and we will keep them in mind while creating new content.
Thanks,
Saketh and Naveen
Disclaimer: This is a personal blog. Any views or opinions represented in this blog are personal and belong solely to the blog owner and do not represent those of people, institutions or organizations that the owner may or may not be associated with in professional or personal capacity, unless explicitly stated
